Customer Acquisition Cost (CAC) is the average cost of acquiring one new paying customer over a specific period. In other words, it is a metric that answers the question: how much does each new customer cost you on average?
The formula is as follows: you take your marketing expenses (and in a more advanced approach, also include sales costs and other related expenses) and divide them by the number of new customers over the same period. There is a simple way to calculate it and a more detailed one — below we will break down the calculation mechanics for each scenario.
It is very important to clearly define who you consider a “new customer.” Traditionally, CAC is calculated only for those who make their first purchase (i.e., we are counting unique individuals).
If you start counting not people but all orders (including repeat purchases from existing customers), the metric becomes CPO (Cost Per Order) — the average cost per order.
To avoid confusion, remember:
CAC measures acquired people, while CPO measures their orders.
CAC formula
Simple CAC formula
This approach is suitable for a quick, “in-the-moment” evaluation of marketing performance. It is most commonly used in businesses with a short sales cycle (e-commerce) or for daily monitoring of advertising campaigns. Here, we focus исключительно on direct media investments.
CAC = Marketing costs for a specific period / Number of new paying customers
Let’s imagine that in July you spent $30,000 on advertising and, thanks to that, acquired 400 new customers. Then the calculation looks like this: CAC = 30,000 / 400 = $75
The resulting $75 means that, on average, this is how much marketing budget is spent to acquire one new customer.
This approach is convenient for comparing acquisition channels (Facebook vs Google), but it is overly “optimistic” because it does not account for salaries, software, and other expenses.
It is important not to confuse CAC with CPA — Cost Per Action — which you see in advertising platforms like Google Ads or Meta. CPA often includes conversions not only from new customers but also from existing ones who returned via ads. This creates an illusion of low acquisition costs.
These metrics align only if the campaign is set up exclusively for first-time purchases and existing customers are excluded from targeting.
However, in day-to-day monitoring, marketers often use these terms interchangeably. This is acceptable for a quick assessment of channel performance, as long as you remember that in ad platforms you see the cost of a specific action (CPA), while for the business the critical metric is the full cost of acquiring a new paying customer (CAC).
Complex CAC formula
The full formula provides a realistic view of the true “cost” of acquisition. It is essential for calculating the actual profitability of a business (unit economics). This approach, known as fully loaded CAC, includes not only the advertising budget but also team salaries, software, agency services, and even a share of overhead costs (rent, equipment).
CAC (fully loaded) = (Marketing + Sales + Tools + Creative + Agencies + Share of overhead) / Number of new unique customers
When you include “Sales” costs, it is crucial to account only for specialists involved in acquisition (lead generation, SDRs, new business sales managers). Salaries of those working with the existing customer base (Account Managers, Customer Success) should not be included — these are retention costs, not acquisition.
Tip: include office rent and equipment only when you need an “absolute” cost for financial reporting. For evaluating day-to-day marketing performance, it is better to use S&M CAC (only Sales & Marketing department costs).
For example, in one month you spent:
- marketing budget — $30,000,
- salaries of sales and marketing teams involved in acquisition — $20,000,
- tools (CRM, analytics, email services) — $5,000,
- agency services — $10,000,
- overhead costs (share of office rent, servers, etc.) — $2,000.
The number of net new customers during this period is 400. The calculation looks like this:
CAC (Fully Loaded) = (30,000 + 20,000 + 5,000 + 10,000 + 2,000) / 400 = $167.50
In this case, the real cost per customer turned out to be more than twice as high as the “simple” calculation ($75).
That is why this detailed approach better reflects actual unit economics (the profitability of each individual customer). It helps avoid the illusion that customers cost less than they actually do and enables better strategic decision-making.
Read more about CAC calculation approaches in SaaS in the article “The Ultimate Guide to SaaS Analytics: Key Metrics and Their Importance”
Blended vs Paid CAC: how not to fool yourself
When you see a CAC figure in a report, it’s important to understand how it was calculated. Marketers often use two different approaches:
- Paid CAC: You take only advertising costs and divide them by the customers acquired from those ads. This is a scalability metric. If you want to know, “What happens if I invest another $10,000 into Google Ads?”, you look at Paid CAC.
- Blended CAC: You take all marketing costs and divide them by all new customers (including those acquired through SEO, word of mouth, or direct traffic). This is a measure of overall business viability.
Why does this matter?
If your overall (Blended) CAC is low only because of “free” organic traffic, while your paid acquisition (Paid CAC) is 5 times higher than LTV, your marketing is not scalable. You will simply burn money trying to grow.
What Customer Acquisition Cost (CAC) is considered good
Depends on LTV
CAC on its own doesn’t tell much — it’s important to look at it alongside LTV (Lifetime Value — the total value a customer brings over time). The most common benchmark is an LTV:CAC ratio of around 3:1. This means that a customer should generate three times more gross profit than it cost to acquire them.
If the ratio is below 3:1, the business should either reduce acquisition costs or increase LTV (through upsells, cross-sells, or loyalty programs). If the ratio is too high (for example, 6:1), it may indicate underinvestment in marketing and missed growth opportunities (you could be acquiring more traffic and customers but are artificially limiting yourself). Or it may simply reflect a very strong acquisition team.
For example, if a customer приносить on average $300 (LTV), and CAC is $100, then the ratio is 300/100 = 3:1 — a healthy level. If CAC increases to $150, the ratio drops to 2:1, signaling potential issues.
You can learn more about LTV and its calculation in the glossary article “Lifetime Value (LTV).”
And about how SaaS companies analyze and use the CAC-to-LTV ratio, we wrote in the article “The Ultimate Guide to SaaS Analytics: Key Metrics and Their Importance”
Industry benchmarks
It is important to understand that what counts as a “good” CAC varies across industries. For example:
- In e-commerce: CAC is highly dependent on the average order value (AOV) and purchase frequency. If the average order value is low, CAC must also remain relatively low; otherwise, unit economics break down.
Benchmarks from various sources (including First Page Sage, Upcounting, and Phoenix Strategy Group) show that the average CAC for retail e-commerce typically falls within the range of approximately $50–90, depending on the vertical.
For example, in mass-market categories such as food & beverage, beauty, or fashion, CAC often ranges between $45–75, while in consumer electronics or luxury goods it can reach $90–175 or more. This once again highlights that a “normal” CAC in e-commerce strongly depends on average order value, margins, and repeat purchase frequency.
You can read more about e-commerce analytics specifics in the article “Marketing Analytics for E-commerce.”
- SaaS, subscription-based businesses, and high-ticket B2B: in these segments, the absolute value of CAC is usually less important than its relationship with LTV and payback.
SaaS companies are willing to pay more to acquire a customer if they stay with the product for a long time and generate recurring revenue. According to industry benchmarks for B2B SaaS, a “healthy” LTV:CAC ratio is around 3:1, with a CAC payback period of approximately 6–18 months. This means that a higher CAC is acceptable if the customer lifetime allows acquisition costs to be recovered through long-term subscriptions.
In high-ticket B2B, acquisition costs can be significantly higher (sometimes thousands or even tens of thousands of dollars). This is considered acceptable if the average contract generates tens or hundreds of thousands of dollars, lasts 2–3 years or longer, and LTV significantly exceeds CAC (typically around 3:1 or higher).
You can read more about SaaS analytics specifics in the article “The Ultimate Guide to SaaS Analytics: Key Metrics and Their Importance”
In summary, a “good” CAC always depends on the business model and the expected payback. For e-commerce, it should be aligned with average order value, margins, and purchase frequency; for SaaS, with LTV and the target payback period; and in high-ticket B2B, higher acquisition costs and longer payback horizons are acceptable as long as LTV significantly exceeds CAC.
Instead of relying on a “market average,” it’s important to regularly calculate your own unit economics. Benchmarking against industry standards for your niche is useful, but you should always adjust your marketing and sales strategy based on the actual performance of your business model.
Payback period
Besides the LTV:CAC ratio, another important metric is payback — the CAC Payback Period. This is the time it takes for a customer to generate enough profit to cover the cost of acquiring them.
Payback = CAC / (ARPU × Gross Margin)
- ARPU (Average Revenue Per User) — average revenue per customer per month.
- Gross Margin — the share of money that remains after subtracting cost of goods/service delivery. If you sell a subscription for $30 and spend $6 to provide it, you keep $24 — that’s an 80% gross margin.
For example, if CAC = $150, ARPU = $30/month, and gross margin = 80%, then: Payback = 150 / (30 × 0.8) = 150 / 24 = 6.25 months.
The overall logic is simple: the shorter the payback period, the better.
It means your investment in the customer returns faster, and the business can scale more confidently.
“Normal” numbers differ by business model: in SaaS, payback within a year is considered good (optimally 6–12 months); in low-AOV e-commerce, payback is often needed within a few months; and in B2B with large contracts, even 2–3 years can be acceptable.
The key is that the payback period must fit your business cycle and resources: the customer should “pay back” their acquisition cost before they stop using the product or placing orders.
How to reduce CAC
You can reduce customer acquisition costs in several ways. It’s important to look not only at spending itself, but also at audience quality, channel effectiveness, and conversion across all stages — because that’s often where the biggest optimization opportunities are.
Optimizing marketing channels
Don’t spread budget across everything. Channels with high CPC and low conversion should be turned off or tested differently. It’s better to redirect money into more effective sources — SEO, email marketing, referral programs, partnership integrations.
Don’t forget to evaluate your marketing activities correctly: not just based on the last non-direct click, but by taking into account multi-channel journeys and using an appropriate attribution model. For example, Facebook may not drive direct conversions, but it can be the first important touchpoint — without which the customer wouldn’t have converted later through search.
To avoid turning off a channel that actually contributes to your sales, it’s important to understand how value is distributed across all touchpoints. You can learn more about this in our article, “Data-driven Attribution and Hands-On Practical Experience.”
Improving website conversion
Even if you bring in traffic at a reasonable cost, a poor website can “eat” all the effort. So sometimes the work needs to happen on the site itself:
- UX/UI optimization — loading speed, easy navigation, clear messaging.
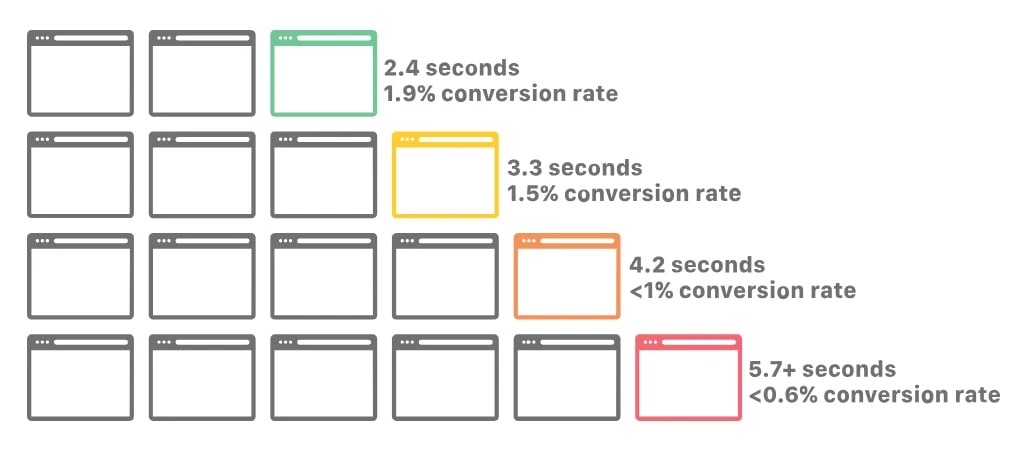
For example, Cloudflare data shows that page load speed has a direct impact on conversion rates.
- A/B testing — headlines, forms, CTAs, offers.
For example, in a real A/B test conducted by the SaaS service Kommunicate, changing the format of the CTA “Try for free” block (by removing an extra field next to the button) resulted in a +25.5% increase in clicks on the free trial button (don’t forget to evaluate A/B test results not only based on button clicks, but also on changes in company revenue — the latter is more important).
- Reducing funnel steps — the fewer clicks from first contact to purchase, the higher the chance users reach the end.
A classic case by UX expert Jared Spool, known as “The $300 Million Button,” showed how removing mandatory registration before checkout and adding a simple “continue as guest” option increased completed purchases by 45% and generated about $300 million in additional annual revenue for a large retailer.
Research by the Baymard Institute supports this finding: 19–24% of shoppers say they have abandoned a purchase due to mandatory account creation.
- Funnel analysis — helps you see exactly where users drop off.
For example, if many people leave at the payment stage, the issue may be missing payment methods or technical bugs.

By the way, we covered how to build such funnels in GA4 in our article “Funnel Exploration in Google Analytics 4: An Advanced Guide to Funnels”
This idea is also supported by a Stripe study conducted on data from their global network (covering transactions equivalent to 1.3% of global GDP). The experiment spanned global e-commerce and the digital industry (including apps, games, and media content) across North America, Europe, and Asia.
The results of testing more than 50 payment methods showed that adding at least one relevant local payment option (beyond bank cards) increases conversion rates by an average of 7.4% and boosts revenue by 12%. For example, in Poland, implementing BLIK (which holds a 70% market share) leads to a 46% increase in conversion, while in Germany, adding PayPal for digital content increases conversion by 47%.
Using retargeting and remarketing
One of the most effective ways to reduce CAC is to work with users who have already shown interest: those who visited your site, added items to the cart, but didn’t complete a purchase. These users are already familiar with your brand, and the cost of bringing them back is usually lower than acquiring a completely new audience.
In different advertising platforms, this approach may be called differently (retargeting in Facebook, remarketing in Google Ads), but the idea is the same: you re-engage people who have already interacted with your business.
Let’s imagine a SaaS platform for marketing automation. Analytics shows that 40% of users sign up for a free trial but don’t connect their CRM.
A CAC reduction strategy could look like this:
- Segmentation. Create a separate audience in Meta/LinkedIn for users who signed up but didn’t complete the key action.
- Content. Instead of a direct “Buy a subscription” message, show them a short video tutorial: “How to connect your CRM in 2 minutes and get your first reports.”
Typically, the cost of bringing such a user back into the product is several times lower than acquiring a new “cold” lead. Since the user base is already formed, the conversion rate from trial to paid increases, which automatically reduces overall CAC. Users who have already seen your interface also tend to have a higher level of trust.
According to aggregated statistics from Demandsage, retargeting significantly improves the performance of advertising campaigns. Users who see remarketing ads are, on average, 3 times more likely to click compared to other users, and their conversion probability is 70% higher than that of a “cold” audience. The median conversion rate for retargeting campaigns is 3.8%, which is noticeably higher than that of standard prospecting campaigns (1.5%).
These figures are based on aggregated international studies (primarily covering the US, European markets, and global reports from platforms such as Google, Meta, and Criteo) and may vary depending on the region, industry, and specifics of a particular business.
Automating marketing and lead generation
A lot of marketing spend is eaten up by manual work: managers manually send emails, remind people about demos, process inquiries. This takes time and money, and often leads to some leads simply getting “lost.” Automation can help significantly here:
- CRM systems help keep all contacts in one place and ensure no customer is forgotten.
- Triggered email campaigns automatically remind users about a trial ending or an abandoned cart.
- Chatbots in messengers quickly answer typical questions without a manager’s involvement.
All of this reduces the cost of handling each lead and shortens the path to purchase.
Improving lead quality
Another common issue is spending on “cold” users who will never convert. If you invest in reaching an audience that is too broad, you’re essentially warming up the wrong market.
To avoid this, it’s important to clearly define your Ideal Customer Profile (ICP) and align with your sales team on what qualifies as a high-quality lead: who these companies are, their size, budget, industry, and the role of the contact person.
Next, narrow your targeting and creatives to match this profile. Instead of targeting “everyone interested in business,” focus your ads on specific industries, company sizes, and relevant roles (executives, marketing directors, founders), and tailor your messaging on ads and landing pages to address their specific needs.
Additionally, you can implement a simple lead scoring system — prioritizing leads that match your ICP and have taken stronger actions (submitted a form, requested a demo, indicated a budget, etc.).
Customer support and retention
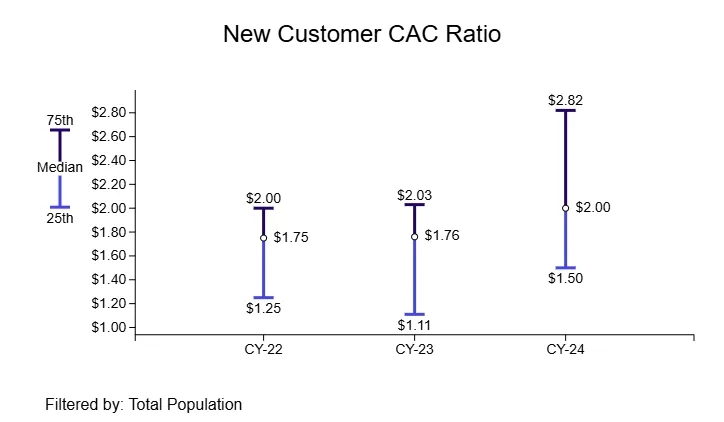
Don’t forget that repeat purchases cost less than acquiring new customers. This is also confirmed by the latest SaaS benchmarks: in 2024, the New CAC Ratio (the ratio of spend on acquiring new customers to their new annual revenue) increased by another 14%. Acquiring customers from scratch is becoming increasingly expensive.
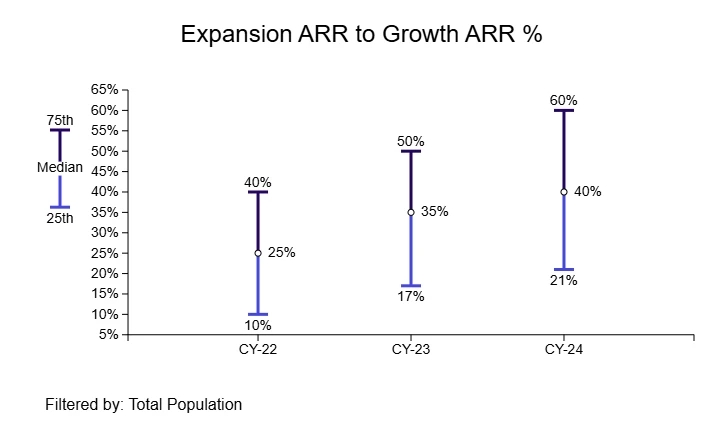
At the same time, on average across the SaaS market, nearly 40% of all new ARR comes not from new customers, but from existing customers through upsells, cross-sells, and contract renewals (Expansion ARR). In large SaaS companies with revenue above $50M, this share exceeds 50%.
Loyalty programs, personalized offers, and audience segmentation based on CRM data are not just “nice-to-haves,” but a real way to improve marketing profitability.
Conclusion
Customer Acquisition Cost (CAC) is a fundamental metric that shows how viable and scalable your business model is (especially when analyzed alongside LTV).
There is no universally “good” or “bad” CAC. This metric should always be evaluated in the context of your industry, product margins, and payback period. However, one key rule remains unchanged: the cost of acquiring a customer should never exceed the profit that customer generates.
We wish you successful campaigns and consistently low CAC!